From responses to decisions: a guide to analytics
Turn raw answers into insight with completion rates, trends, and top-answer breakdowns.
The FormSnapp Team
May 28, 2026 6 min read
Collecting responses is the easy part. The value is in what you do next — and a spreadsheet of raw answers rarely tells you anything on its own. Turning responses into decisions is a skill, and like any skill it follows a repeatable process. Here's a simple framework for reading your results.
Start with completion
Before you read a single answer, look at your completion rate and where people dropped off. A question that consistently loses respondents is telling you something — it's confusing, too personal, or too much work. Fixing that one question often matters more than any individual answer you collect, because it improves the quality and quantity of every response that follows.
Read the distribution, not the average
Averages hide the story. A satisfaction score of 3.5 could mean everyone is lukewarm, or it could mean half your customers love you and half can't stand you — two very different situations that demand very different responses. Always look at the full breakdown of answers, not just the summary number. The shape of the distribution is usually where the insight lives.
Watch trends over time
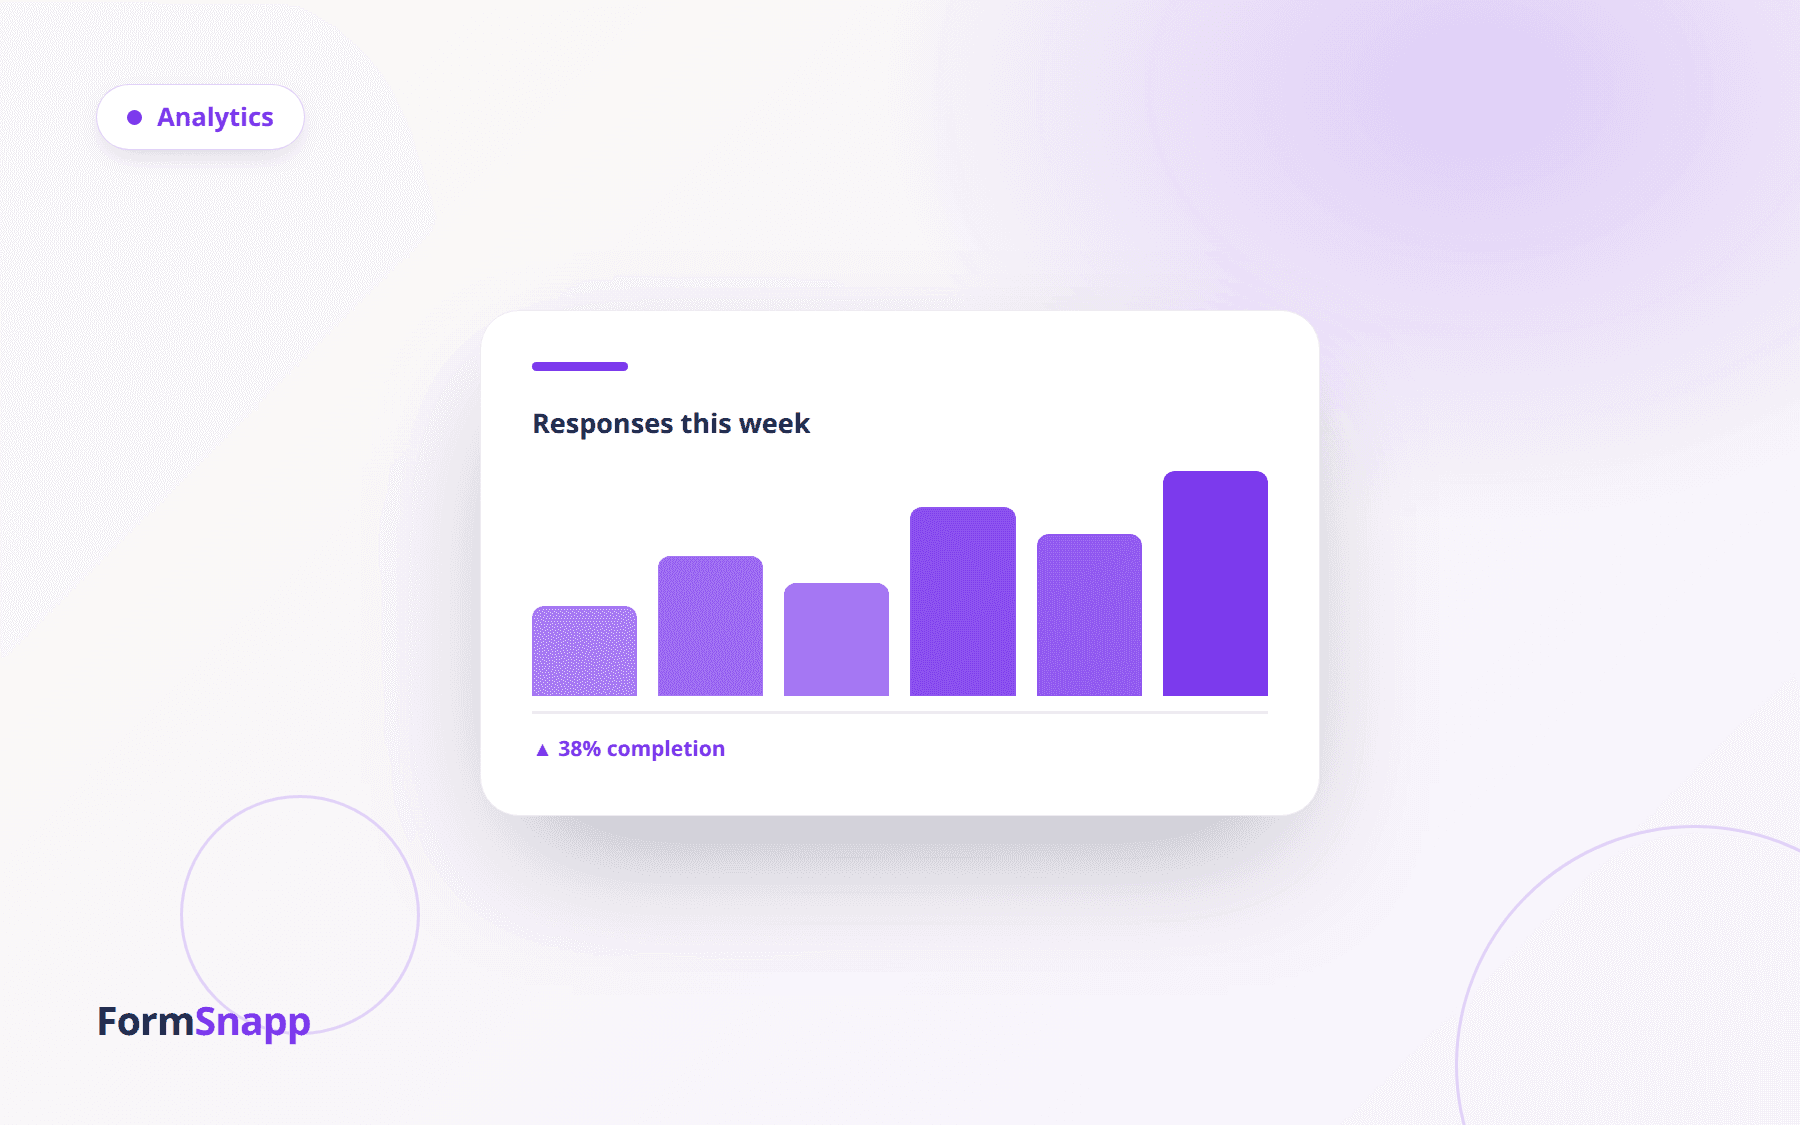
A single snapshot is a data point; a trend is a signal. Track the same metric across weeks and you'll see whether a change actually moved anything, or whether you're just reacting to noise. This is why asking a short set of consistent questions repeatedly beats a one-off mega-survey — consistency is what makes comparison possible.
Segment to find the why
Once you see a pattern, ask who is behind it. Do new customers rate you differently from long-time ones? Does a particular source of traffic drop off at a particular question? Segmenting turns a flat number into an explanation you can act on.
Insight without the spreadsheet
FormSnapp's built-in analytics show completion, drop-off, trends, and top-answer breakdowns for every form — no exports or pivot tables required. The goal is to shrink the distance between collecting an answer and acting on it.
- Check completion and drop-off before reading answers.
- Look at distributions, not just averages.
- Compare the same metric over time to separate signal from noise.
- Segment your data to turn patterns into explanations.
The FormSnapp Team
We build FormSnapp — beautiful forms that people actually finish, with analytics that turn every response into a decision. We write about forms, surveys, and getting better data.